Required security profile permissions Custom Reports Edit.
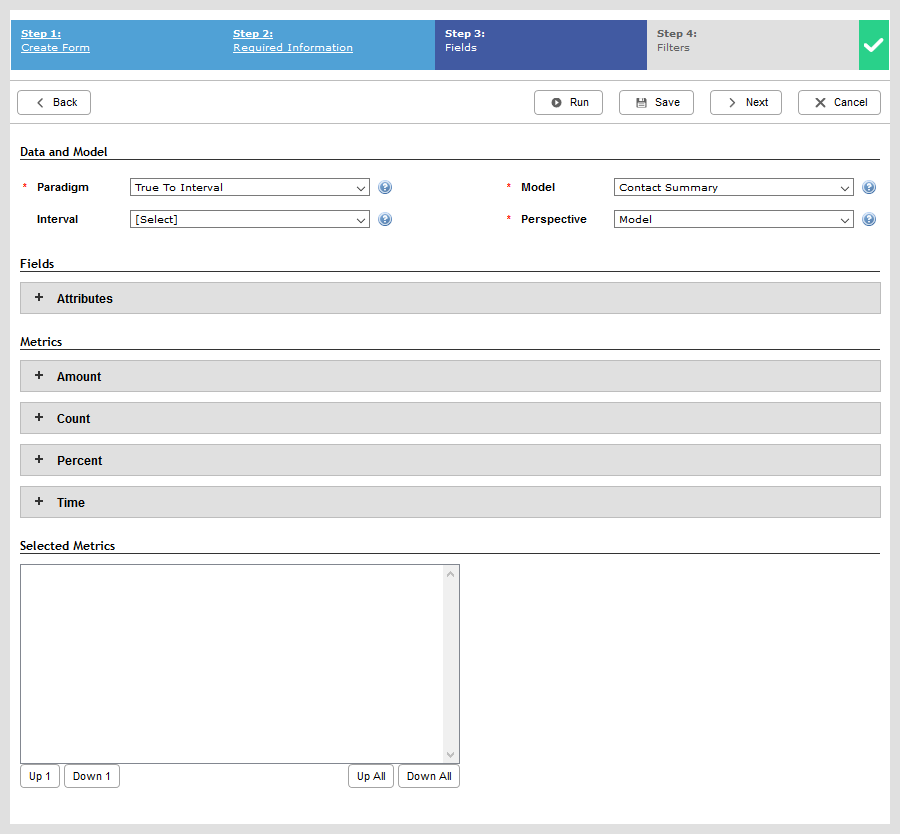
When you create a custom report you must select the perspective from which the report generates, the intervalA period between points, limits, or events, such as dates or times. at which it measures data, and the metrics that you want the report to include.
The NICE inContact system stores 25 months of contact summary data and 90 days of contact detail data. You can only run 30 days of data at a time.
Tooltips are available for each entry and contain a brief description as noted by the question mark.

Data and Model
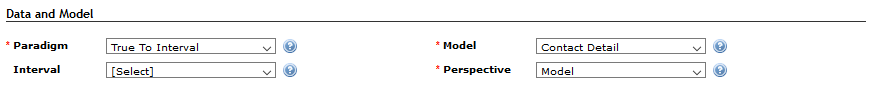
- Paradigm
-
Defines the method or paradigm for summarizing interval-based data. Paradigms are summarization methodologies that drive how data-summary data appears in an intervalA period between points, limits, or events, such as dates or times. view.
-
Contact Start – Generates information beginning when the contact starts regardless of how long it continues. It provides clear contact traceability, the data is easy to summarize, and it is generally more reliable for auditing and third-party billing. However, this paradigm provides no granular insight into how a contact might impact multiple interval periods.
When you choose Contact Start as your Paradigm, you can select Contact Summary or Contact Detail as your Perspective. The Personal Connection Perspective requires that you use the True to Interval Paradigm.
-
True to Interval – Breaks out summarized count and time data across the intervals in which they take place. It provides an accurate representation of what happens within each interval and is generally more reliable for workforce management. However, if you create a summary or total off an interval report using this paradigm, it causes inflated contact counts.
The following tables demonstrate the difference between how Contact Start and True to Interval reports calculate the same data. Each table displays a 15-minute interval report with two contacts — one 30-minute contact and one seven-minute contact — both of which started at 8:00.
True to Interval
Interval Handled Average Handle Time 8:00 — 8:15 2 11:00 8:15 — 8:30 1 15:00 It appears agents handled three contacts in the 30-minute time period, even though they only handled two. This is because one of the contacts spanned multiple intervals and the report counts contacts once in each interval they span.
Contact Start
Interval Handled Average Handle Time 8:00 — 8:15 2 18:30 8:15 — 8:30 0 0:00 Time components, such as AHT, can display numbers greater than the length of the interval. This is because long-running contacts, all grouped into the interval in which the contact started, can inflate values.
-
- Model
-
Specifies the model you want the report to follow. You must choose one of the following:
- Contact Summary — Metrics that generate general information become available in the Fields. Contact summary enables you to generate reports that provide a high-level view of contact data. If the Agent Name, Campaign Name, Skill Name, Team Name, Disposition Name, Point of Contact Name, or Location Name is changed in Central, the application tracks that attribute and combines the data for both the new and old name together. Data in this model updates every six hours.
- Contact Detail — Metrics that generate specific information become available in the Fields. Contact detail enables you to view data at the contact IDA unique numerical identifier assigned to each contact. level. In addition to the listed Contact Summary attributes, if the Tag Name or Force Logout by Agent Name is changed in Central, the application tracks that attribute and combines the data for both the new and old name together. Data in this model updates every six hours.
- Intraday Contact Detail — Metrics that generate specific information become available in the Fields. Intraday contact detail enables you to view data at the contact ID level. It contains a rolling two days' worth of data. In addition to the listed Contact Summary attributes, if the Tag Name or Force Logout by Agent Name is changed in Central, the application tracks that attribute and combines the data for both the new and old name together. Data in this model updates every hour.
- Personal Connection — Metrics that generate specific information about outbound dialing become available in the Fields. In addition to the listed Contact Summary attributes, if the Disposition Classification is changed in Central, the application tracks that attribute and combines the data for both the new and old name together. Data in this model updates every six hours.
*For the Contact Summary and Contact Detail customer reports, the refresh occurs in scheduled intervals every 6 hours. The default intervals are 2 a.m., 8 a.m., 2 p.m., 8 p.m. MST but could vary based on the assigned cluster.
- Interval
-
Displays the data for each intervalA period between points, limits, or events, such as dates or times. the data has crossed. If you choose to run the report based on an interval, this field specifies the interval as one of the following:
Intervals
- 15 Minutes — The report displays data for each interval of 15 minutes in the specified time range.
- 30 Minutes — The report displays data for each interval of 30 minutes in the specified time range.
- 60 Minutes — The report displays data for each interval of 60 minutes in the specified time range.
- 1 Day — The report displays data for each day in the specified time range.
- Week — The report displays data for each week in the specified time range.
- Month — The report displays data for each month in the specified time range.
- Year — The report displays data for each year in the specified time range.
Group By
- Day of Week — This option groups the results by day of the week (Sunday through Saturday) for the specified times and dates.
- Hour of Day — This option groups the results by hour of the day in military time (0 - 23 hours) for the specified times and dates.
- Perspective
-
Provides a view of data attributes and metrics pertaining to a particular type or subject area. When you select a Perspective, the fields and metrics that do not relate to that perspective become unavailable.
-
Model – Lets you select all of the available attributes and metrics.
- Agent – Lets you select only the available attributes or metrics that relate directly to an agent.
- Contact – Lets you select only the available attributes or metrics that relate directly to a contact.
-
IVR – Lets you select any of the available attributes or metrics that relate directly to IVR.
-
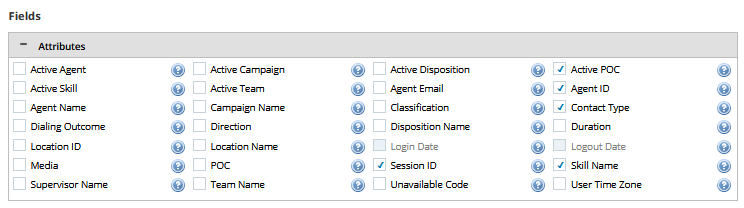
Fields
For a description of each of the field attributes, see Data Dictionary.
The field attributes that appear in the report output. You may choose up to 10 attributes per single report.
Attribute combinations increase the number of rows in a report. The more detailed attributes you include, the more you risk creating a report with a high number of rows that times out. Because Contact ID and Session ID each generate such a large number of rows in a report, you cannot select both attributes in the same report.
General Attributes
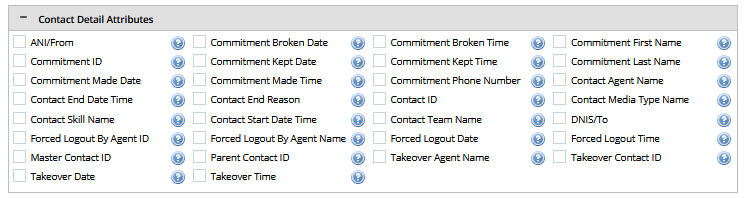
Contact Detail Attributes
Agent Detail Attributes

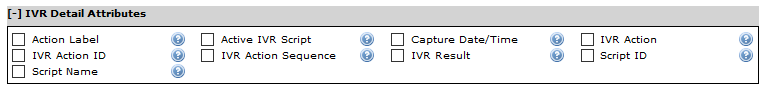
IVR Detail Attributes
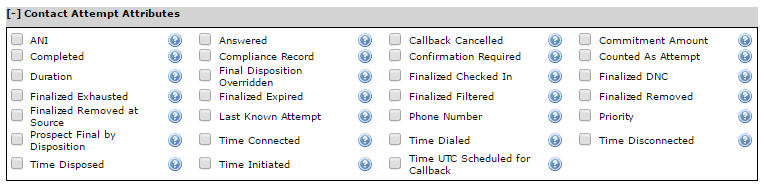
Contact Attempt Attributes
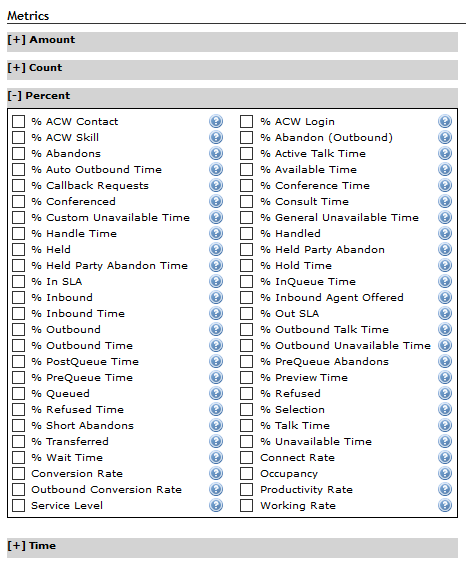
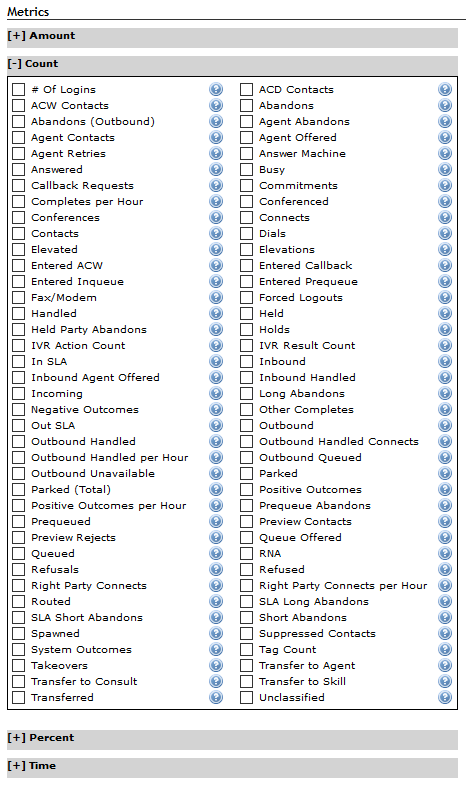
Metrics
For a description of each of these metrics, see Data Dictionary.
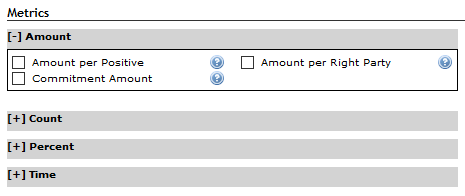
Amount
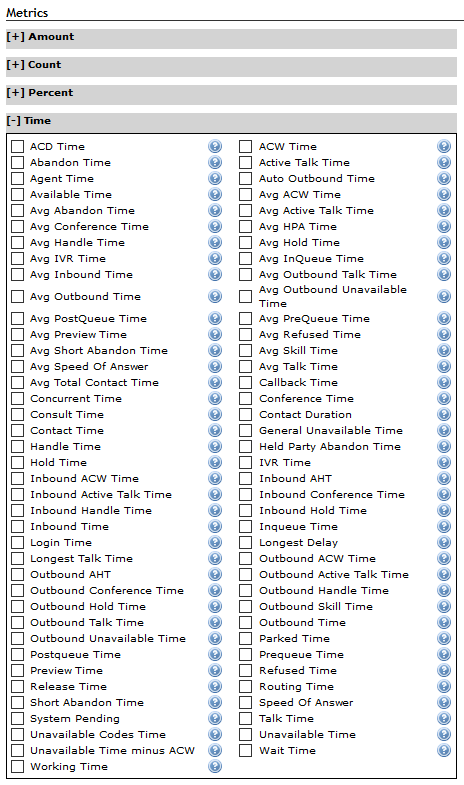
Time
Percentage
Count
Selected Metrics
The Selected Metrics table lists all the metrics you selected and the order in which they appear. You can use the buttons to change the order in which the metrics appear in the report.
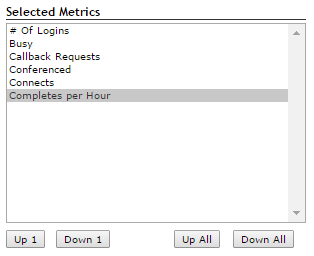
- Down 1
- Moves the selected metric one space down from its current location. For example, if you select Busy and click Down 1 in the example above, Busy and Callback Requests would switch places.
- Down All
- Moves the selected metric to the bottom of the list. For example, if you select Busy and click Down All in the example above, Busy would move to below Completes per Hour.
- Up 1
- Moves the selected metric one space up from its current location. For example, if you select Conferenced and click Up 1 in the example above, Conferenced and Callback Requests would switch places.
- Up All
- Moves the selected metric to the top of the list. For example, if you select Conferenced and click Up All in the example above, Conferenced would move above # of Logins.


