Required security profile permissions: inContact Interaction Analytics Pro View
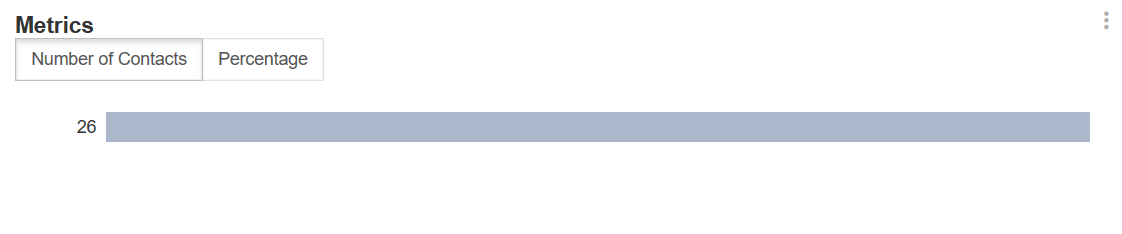
The Metrics Widget is a bar chart that allows you to view applicable contacts that match criteria set by a single metric. For example, you can view the contacts where the hold time was more than 30 seconds or contacts where the contact was abandoned. This widgetA graphical chart with data that meets specified filter criteria to help contact center supervisors and managers understand trends in the contact center. can display many different things and can have any title. In the following image, the Metrics Widget displays the number of contacts that occurred during the currently selected time period where an abandon did not occur.
Read the Chart
The bars indicate the number or percentage where a certain threshold was met, if a threshold is configured. To view details about the bar measurement, hover over the bar. A bubble appears containing the threshold met and the number or percentage associated with it. See Metrics Widget for a list of all possible metrics the widgetA graphical chart with data that meets specified filter criteria to help contact center supervisors and managers understand trends in the contact center. might display.
Change the View
You have two options for viewing information in the Metrics Widget:
- To view an exact number of contacts where the selected metric met a certain threshold, select Number of Contacts. This is the default view.
- To view the percentage of contacts where the selected metric met a certain threshold, select Percentage.
Show Contacts
When you click a bar in the chart, you can click Show Contacts to view the contacts that match the metric during this time period. For example, if you click a bar that indicates 46 contacts were not abandoned during the time period and select Show Contacts, the Contacts Widget opens to display those 46 contacts.
You can perform all the same actions in this pop-up that you can the Contacts Widget, including viewing transcripts and listening to call recordings. For instructions, see Contacts Widget.
Export the Metrics Chart as CSV
These instructions detail how to export the chart into .csv format.
- Click the down arrow in the top right corner of the chart.
- Click Export.
Save the Metrics Chart as an Image
These instructions detail how to save the chart as an image.
- Click the down arrow in the top right corner of the chart.
- Click Save Chart as Image.


