Required security profile permissions: inContact Interaction Analytics Pro View
The Sentiment Trend Widget displays the sentimentThe overall mood of the contact, or the result of the call as determined by analysis of words, phrases, and context of the transcript. An interaction can be positive (blue), negative (red), mixed (dark gray), or neutral (light gray). of contacts over time. You can drill down to see what happened in spikes of certain sentiments. Some spikes are just increases in call volume, but the chart can show when the number of positive or negative calls fluctuates and allows you to investigate the cause.
Read the Chart
SentimentThe overall mood of the contact, or the result of the call as determined by analysis of words, phrases, and context of the transcript. An interaction can be positive (blue), negative (red), mixed (dark gray), or neutral (light gray). is color-coded consistently in Interaction Analytics Pro so that any sentiment data in the charts is represented by the following color assignments:
- Negative — red
- Positive — blue
- Mixed — dark gray
- Neutral — light gray
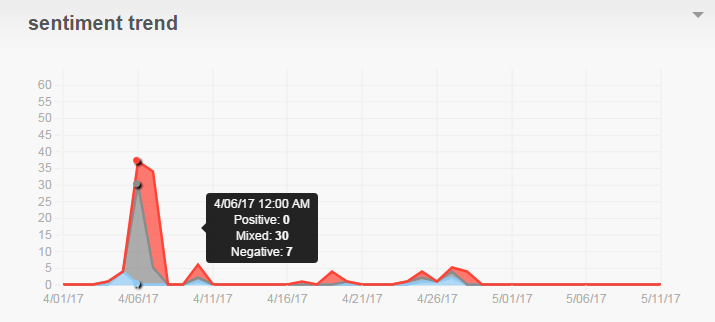
The vertical measurement is the number of contacts that occurred and the horizontal measurement is time. If you are looking at a short period of time, it is in hours and if you are looking at a long period of time, it is in days. Any point on the chart is the number of calls per sentiment that occurred on a certain day or at a certain time.
When you hover over a colored area of the chart, you can see the date and time the contacts occurred and number of contacts that occurred per sentiment at the time.
Show Contacts
When you click a colored area on the chart, you can select the sentiment type you want to use to filter the contacts. You can select Positive, Negative, Neutral, or Mixed. The Contacts Widget opens in a new window, filtered to display only contacts from that time with the sentiment you chose. For example, if you click an area on the chart and select Negative, the Contacts Widget opens to display all contacts with a negative sentiment that occurred during the time you selected.
You can perform all the same actions in this pop-up that you can the Contacts Widget, including viewing contacts and listening to call recordings. For instructions, see Contacts Widget.
Export Sentiment Trend Chart as CSV
These instructions detail how to export the chart into .csv format.
- Click the down arrow in the top right corner of the chart.
- Click Export.
Save Sentiment Trend Chart as an Image
These instructions detail how to save the chart as an image.
- Click the down arrow in the top right corner of the chart.
- Click Save Chart as Image.


