This topic explains how to set up dashboards. You can create multiple dashboards for different purposes and switch between them.
Dashboards Page
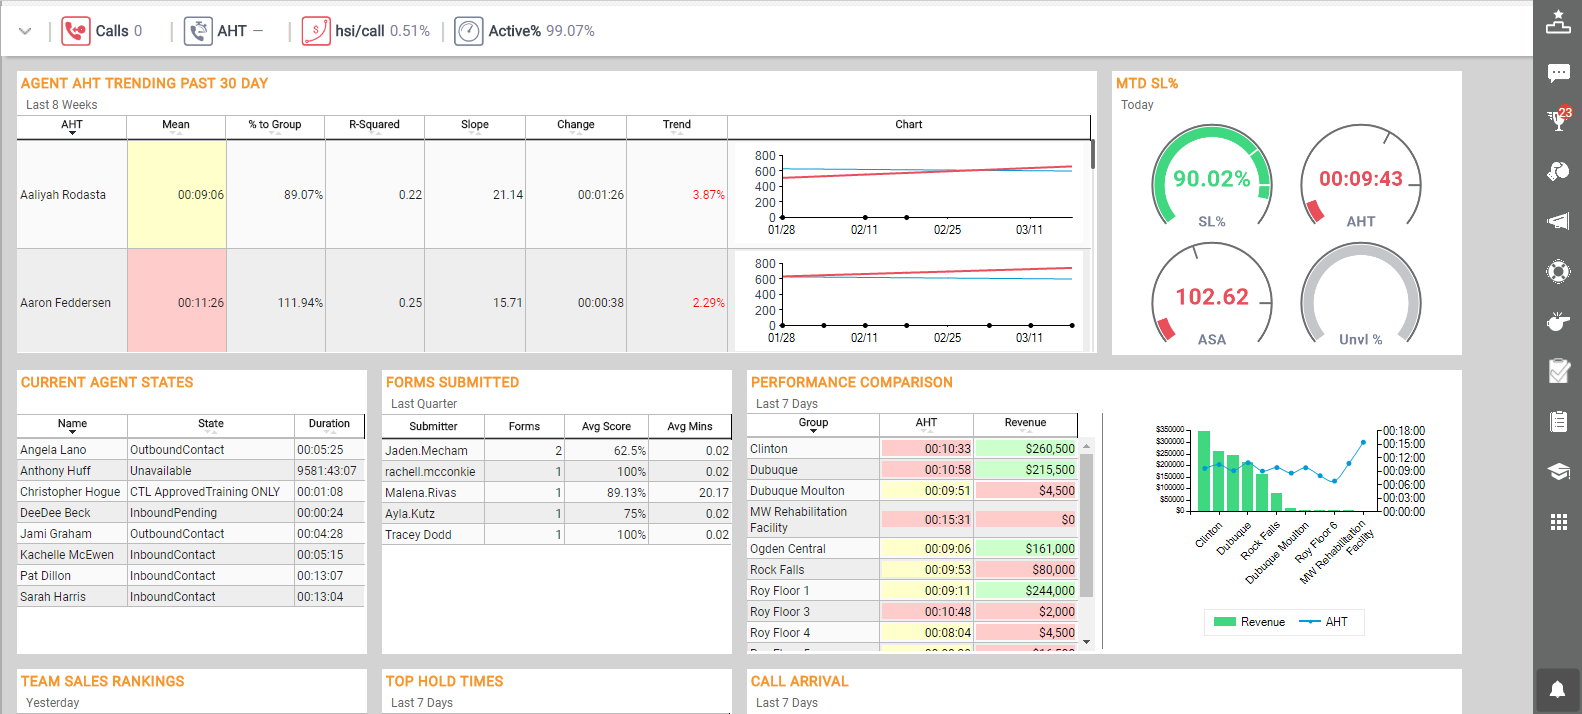
The Dashboards page loads when you open inView, displaying a blank canvas until you make a dashboard selection. The name of the dashboard being displayed appears to the left of the top navigation menu. In the preceding image, the Supervisor dashboard is displayed.
You can access dashboards you have created, as well as dashboards shared by others, from the Clearview menu. Available dashboards are separated into different categories, such as My Dashboards, Shared, and so forth.
You can edit dashboards you create. You cannot edit shared dashboards unless you have permission to do so, but you can save a copy of a shared dashboard and use it as the basis for a new dashboard. For example, you might want to save a copy of the Supervisor dashboard in the previous image, and configure it to show only your team. Starting with an existing dashboard can save time when creating a new dashboard.
Create New Dashboards
- Click Clearview and select a dashboard.
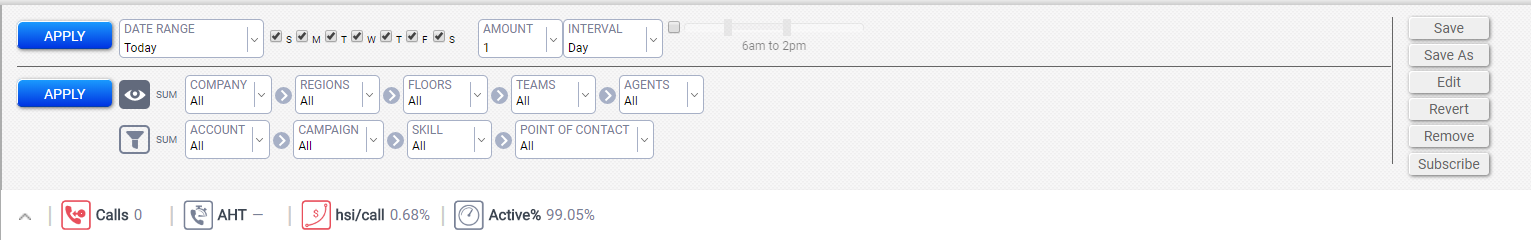
- Click the Expand icon (indicated by a downward-pointing angle bracket) on the KPI Bar to display the master filter.
- (OPTIONAL) Configure a default filter for the dashboard.
- Click Save As.
- Type a Name and, optionally, a Description for the dashboard.
- Click Save.
- If there are existing modules, click the red X in the upper right corner of any modules that you do not want to include in the new dashboard.
- Click Modules in the toolbar. Hovering over a module slides out preview information next to the modules window.
- Click a module to add to the dashboard and drag it to indicated spot on the dashboard.
- In the module settings window, configure the module. To use the default configuration, click anywhere on the screen except the module settings window.
- Repeat the previous three steps until you have added and configured all the modules you want to display on this dashboard.
You can click and hold along the top of the module and drag it to a new location on your dashboard. Existing modules on your dashboard may automatically shift to accommodate a new layout. You can also click the star next to a module to add it to a Favorites list, which appears at the top of the modules list for quick access.
Create a New Dashboard from a Copy
- Click Clearview and select a dashboard.
- Click the Expand icon (indicated by a downward-pointing angle bracket) on the KPI Bar to display the master filter.
- (OPTIONAL) Configure a default filter for the dashboard.
- Click Save As.
- Type a Name and, optionally, a Description for the dashboard.
- Click Save.
- Click the red X in the upper right corner of any existing modules that you do not want to include in the new dashboard.
- Click Modules in the taskbar.
- Click a module you want to add to the dashboard and drag it to indicated spot on the dashboard.
- On the module settings page, configure the module. To use the default configuration, click anywhere on the screen except the module settings window.
- Repeat the previous three steps until you have added and configured all the modules you want to display on this dashboard.
Edit Dashboards
This section explains how to edit an entire dashboard. For information on editing an individual dashboard module, see Modules.
- Click Clearview and select the dashboard you want to edit. You can only edit dashboards you created.
- Click the Expand icon (indicated by a downward-pointing angle bracket) on the KPI Bar to display the master filter.
- Click one of the following buttons, depending on the changes you want to make:
- Save As — Allows you to save a copy of the dashboard
- Edit — Allows you to change the dashboard Name, Description, or both, or to Share the dashboard
- Revert — Allows you to remove any unsaved changes and return the dashboard to its last saved state
- Remove — Allows you to delete the entire dashboard
- Subscribe — Allows you to subscribe to emailed reports based on the dashboard, to send such reports to others, or both
- When you have finished editing the dashboard, click Save.
Share a Dashboard
- Click Clearview and select the dashboard you want to share. You can only share dashboards you have created and saved.
- Click the Expand icon (indicated by a downward-pointing angle bracket) on the KPI Bar to display the master filter.
- Click Edit and then click Share.
-
 Configure dashboard access.
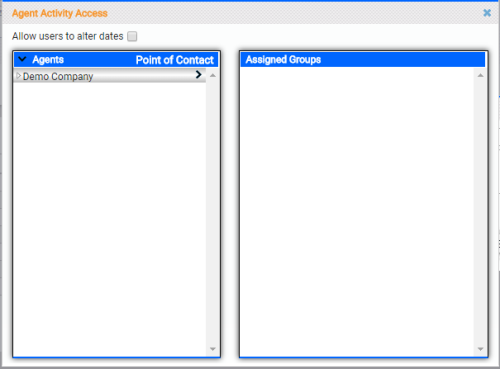
- Click the black arrow to the left of Agents in the left section to expand all, or click the white arrow to the left of a group and drill down level-by-level to locate the agent or group.
- (OPTIONAL) To configure access based on points of contact instead of agent or group, click Points of Contact in the left section and then use the methods described in the previous step to locate the point of contact.
- Click the black arrow to the right of a group or agent to move it to the right section under Assigned Groups.
- In the Access window, select the level of access for the agent or group. The Profile determines the level of data returned when the agent or group accesses the dashboard. You should not use a profile that exposes more information than the agent or group should be able to see.
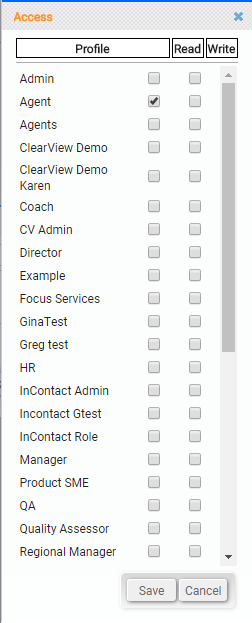
- For the Profile you want to use, select the Read checkbox if the agents or groups should be able to view the dashboard exactly as it was created, even if the data shown is outside their normal security access level. If you select only this checkbox, they cannot change any of the settings on the dashboard or add or remove any modules. They can save a copy of the dashboard to use as the basis for a new dashboard.
- Select the Write checkbox if the agents or groups should also be able to view the dashboard, but only see the data that their security level allows. Users with Write access can save a copy of the dashboard to use as the basis for a new dashboard, and can also edit the original dashboard at any time.
- To remove an entity from the Assigned Group section, click the Delete icon (indicated by a minus sign in a blue circle) to the right of the entity.
- (OPTIONAL) Select the Allow users to alter dates checkbox if you want users to be able to configure the time period displayed on the dashboard using the master filter.
- Click the X in the upper right corner to close the dashboard access window.
- Click Save.


