Required security profile permissions: inContact Interaction Analytics Pro View
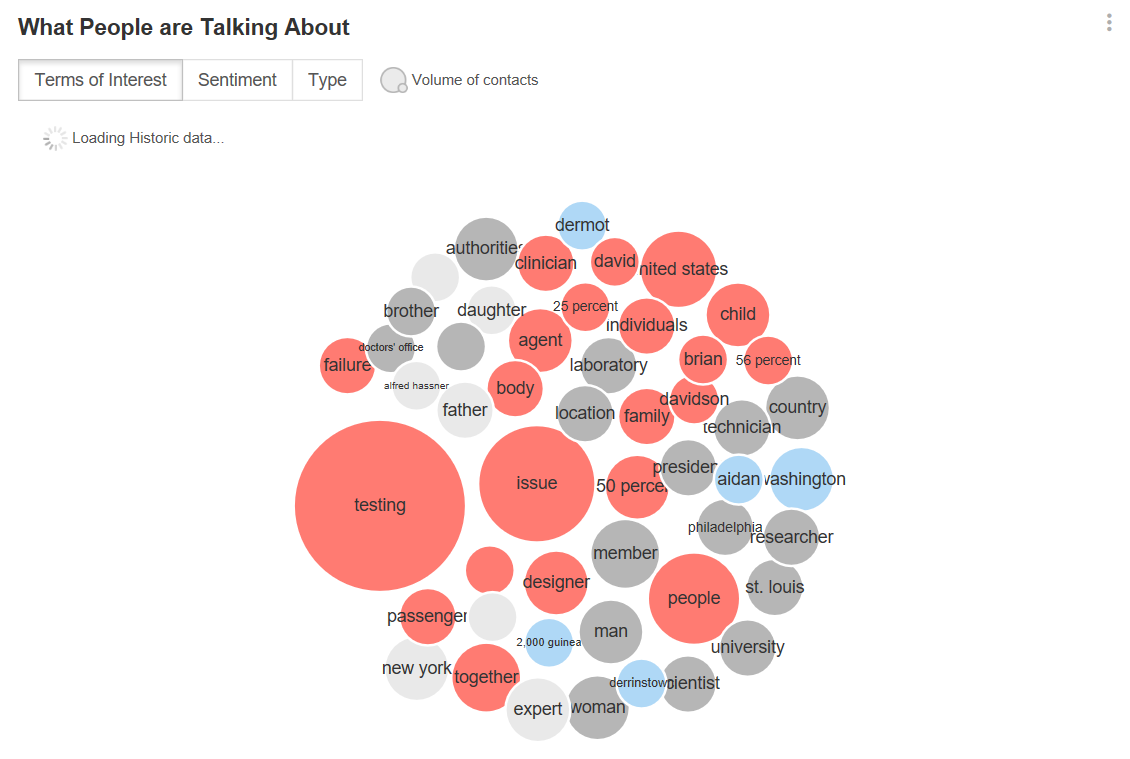
The What People Are Talking About Widget displays the terms of interest people are talking about in the topicA set of voice, email, or chat transcriptions from your contact center that spans a specific period of time and matches your specified filter criteria.. The terms of interest are entitiesA term that represents a theme or concept. NICE inContact Interaction Analytics Pro intelligently searches for related keywords and context to gather instances of the concept rather than searching for every specific instance of a keyword. For example, the 'sound quality' entity applies to transcripts where people say things like "I can't hear you" or "you're breaking up". You can create custom entities specific to your organization in the company profile., not keywordsAn individual word you enter into NICE inContact Interaction Analytics Pros to flag it as a word with special significance or as a word to use as criteria for including or excluding data from a topic or widget.. This means the application searches for the term of interest intelligently based on what is programmed in the application and what you put in the company profileA form where you can create custom entities that inContact Analytics can use to parse and analyze data that is of interest to your company.. You can sort the chart by terms of interest, sentimentThe overall mood of the contact, or the result of the call as determined by analysis of words, phrases, and context of the transcript. An interaction can be positive (blue), negative (red), mixed (dark gray), or neutral (light gray)., or type. The bubbles separate into categories depending on the view you choose. The chart can help you understand trends occurring in the conversations in your contact center by allowing you to view terms that have recently dropped from the top 50 terms and by marking terms new to the top 50 with a dotted border.
Unhelpful words such as 'you', 'and', or 'a' do not appear in the widget. The size of the bubbles directly correspond to the number of mentions, so the larger the bubble, the more common the term is in conversations in your contact center. Hovering over a term displays the number of mentionsThe appearance of a keyword, phrase, or entity in topic transcripts., the sentimentThe overall mood of the contact, or the result of the call as determined by analysis of words, phrases, and context of the transcript. An interaction can be positive (blue), negative (red), mixed (dark gray), or neutral (light gray)., and type. You can filter the widget to include contacts containing certain terms and to exclude contacts containing others. Clicking bubbles also gives you the option to view matching contacts where the mentions occurred and includes call recordings for voice contacts.
View Details about a Term
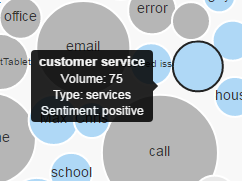
Hover your cursor over a bubble in the chart to see details about the term, including the name of the term—which is useful when the bubble is too small too display text, as shown in the preceding image—the Volume or number of contacts that mention the term or one of its variants, the Type of term, and the Sentiment associated with the contacts associated with the term.
Change the Chart View
You can choose from two different views on this chart:
Top 50
This is the default view. It displays the top 50 themes people mention most often in conversations in your contact center. It always contains 50 terms, so when you apply a filter or hide a term, new terms appear to take the place of removed terms.
Dropped from Top 50
When you select Dropped from Top 50 from the What People Are Talking About widget, you see a bubble chart containing themes that were recently in the top 50 most mentioned terms in your call center but have recently dropped out. It allows you to see trends in the topics discussed.
Filter Based on Data in the Chart
You can filter any widgetA graphical chart with data that meets specified filter criteria to help contact center supervisors and managers understand trends in the contact center. using the dashboard filter pane (indicated by a blue funnel in the top right corner of your screen). You can also filter the What People Are Talking About Widget based on terms in the chart:
- To view data only from contacts that contain one of the terms, click the term and select Include. The chart refreshes to display the filtered data.
- To view data only from contacts that do not contain one of the terms, click the term and select Exclude. The chart refreshes to display the filtered data.
- To remove a term from the chart without affecting the data displayed, click the term and select Hide Value. The term disappears from the chart and a new one takes its place.
Filtering inside the chart is a quick and easy way to apply entity filters. If you want to modify filters later, use the Entity drop-down of the dashboard filters pane.
Filter Based on Entity Types in the Chart
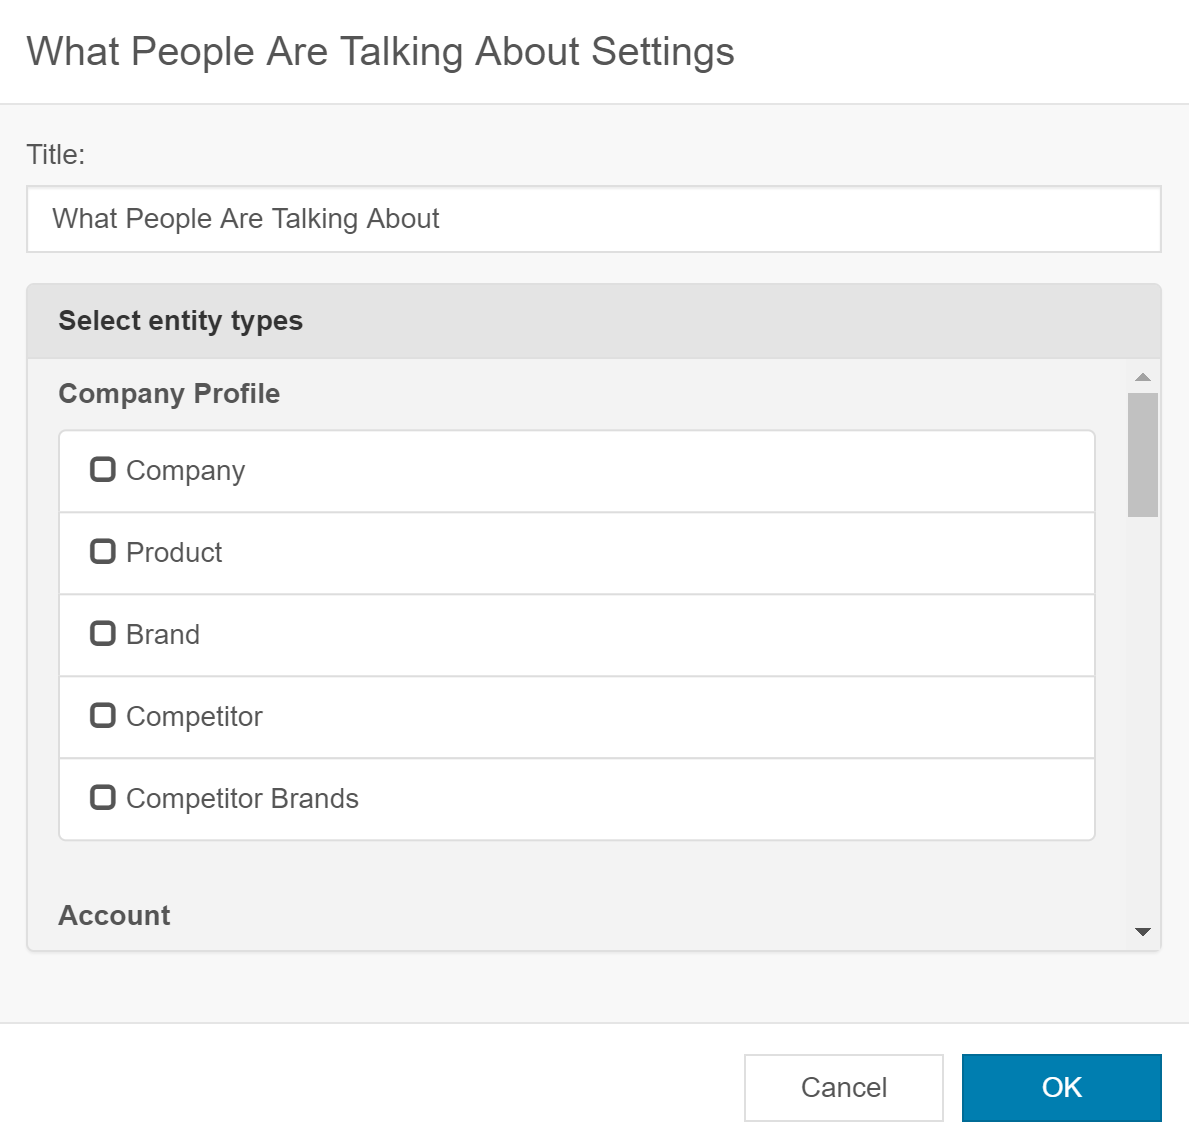
You can filter the What People Are Talking About Widget based on entity types in the chart. For example, if you want to view only product entities, you can select Product and view the top 50 for that entity type.
- Click Edit Workspace.
- Click Settings (indicated by a blue gear in the top right corner).
- Select the desired entity types.
- Click OK.
- Click Done.
Remove Filters Applied in the Widget
If you have applied filters to the data and you want to remove any of them, do the following:
- Click the Entities drop-down in the dashboard filters pane. You can click the reset icon to the right of the word Entities, or you can remove filters from individual entities by clearing the checkbox to the left of them. See Filter by Entities for more information.
- To display terms that you hid from the chart, click the down arrow on the title bar of the What People Are Talking About widget and select Hidden Values. In the Hidden Values window, click the gray X beside each term you want to un-hide. Click Close.
Sort the Terms
You can sort the bubble chart to organize the terms to make the data you want easier to consume. You can sort the terms by doing the following:
- To sort the term bubbles based on terms of interest, which is the default view, click the Terms of Interest button. This view displays all terms you might be interested in based on the type of data collected in the topic.
- To sort the term bubbles based on sentiment, click the Sentiment button. This view displays the terms in groups depending on whether the contacts associated with the term are positive, negative, neutral, or mixed.
- To sort the term bubbles based on type, click the Type button. This view displays the terms organized by the following term types:
- Staff — Entities that relate to your contact center staff, such as 'agent', 'customer care', or 'technical support'.
- Person — People mentioned by name.
- Company — Companies mentioned. This includes your company and others mentioned in the company profile configuration.
- Issue — Issues discussed in contact center conversations, such as 'sound quality' or 'open ticket'.
- Assorted — Terms that do not fall under any of the other types.
View Related Transcripts
To view transcripts relating to a bubble in the chart, click the bubble and select Show Contacts.
Click on a line of text to view the transcript. The related entity is highlighted. You can perform all the same actions in this pop-up that you can the Contacts Widget, including viewing transcripts and listening to call recordings. For instructions, see Contacts Widget.


