Required security profile permissions Custom Reports Create
Create a Custom Report Template
- If you want to apply a header to the top of all reports generated by this template, create the header first.
-
-
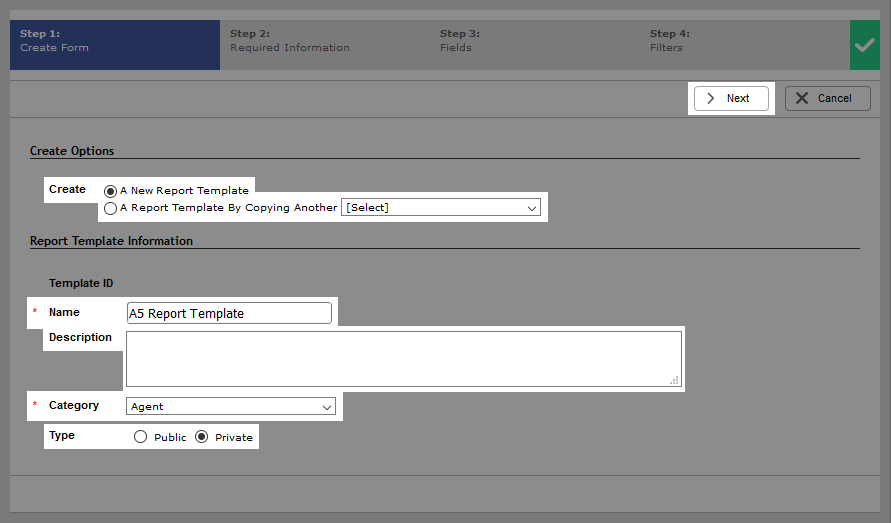
Click Create New.
-
Select a Create option. Provide a Name, Description, Category, and Type for the template if needed. Note that Global Type templates may only be copied and not edited.
-
 (OPTIONAL) Copy an existing custom report template.
-
To make a copy of an existing custom report template, go to custom reports and use the search feature at the top of the table, the page navigation at the bottom, or the sort feature to locate the template you want to copy.
-
Choose Create a Report Template by Copying Another, and select the template you want to copy.
-
Name the new custom report template. The form auto-fills to match the chosen template and requires no further modification unless you want to tweak it.
-
Set the Type to either Public or Private.
-
-
Click Next.
-
Select a Date Range, Start/End Time, Time Zone, Time Format, Percent Format, and provide any desired Output Format specifications. If you want to add a header to the top of the generated report, select the header you want in the Report Template Header Name drop-down. Click Next.
The NICE inContact system stores 25 months of contact summary data and 90 days of contact detail data. You can only run 30 days of data at a time.
It also stores only two rolling days' worth of hourly intraday contact detail data.
-
Specify a Paradigm, Model, and Perspective. When you select a Perspective, all Fields and Metrics that do not relate to it disappear.
-
Select the Fields and Metrics you want the report to display. To do so, click the plus sign beside Attributes, Contact Detail Attributes, or Agent Detail Attributes for Fields or beside Amount, Time, Percent, or Count for Metrics. Select the checkbox of each feature or metric you want the report to display.
-
You can specify the order in which the features and metrics will appear in the report by using the Selected Metrics box. To move a metric up or down, click it and press one of the following buttons:
-
Up 1 – Moves the metric one space higher on the list
-
Down 1 – Moves the metric one space lower on the list
-
Up All – Moves the metric to the top of the list
-
Down All – Moves the metric to the bottom of the list
To remove features or metrics from the report, clear the corresponding checkbox. You can also remove metrics by double-clicking them in the Selected Metrics list.
-
-
Click Next.
-
(OPTIONAL) Add filters to the report template.
-
Click Add Dimension Group to create a filter statement with attributes, like names or booleans. Click Add Measure Group to create a filter statement with metrics, such as numbers of occurrences or time.
-
Choose the selection you want to filter by, which can be any attribute or metric regardless of whether you include it in the report or not. Select an operator with which to compare the selection with the value. For more information about the operators you can choose, see Create Report Template: Filters Page. Choose or type a value.
-
To add another condition, click Add Filter.
-
Set the new drop-down on the left to and or or to set the relationship between this filter and the preceding one. Configure the rest of the filter as you did the previous one.
-
To add more filters, repeat steps A - D.
-
To remove filter statements from a group, select the minus button to the right of the statement. To remove a filter group, click the red X in the top right corner of the group window. Click Remove All to remove all groups and filters immediately.
- If you are editing a template, click Done.
-
-
Click Save to save your new report template. To return to another section of the template wizard, click Back. To discard your new report template, click Cancel. To run the report now, click Run.
Reports run this way may contain up to 13 months of data and time out after running for three minutes. Running a report with more data or that takes longer requires that you schedule it.
Edit a Custom Report Template
-
-
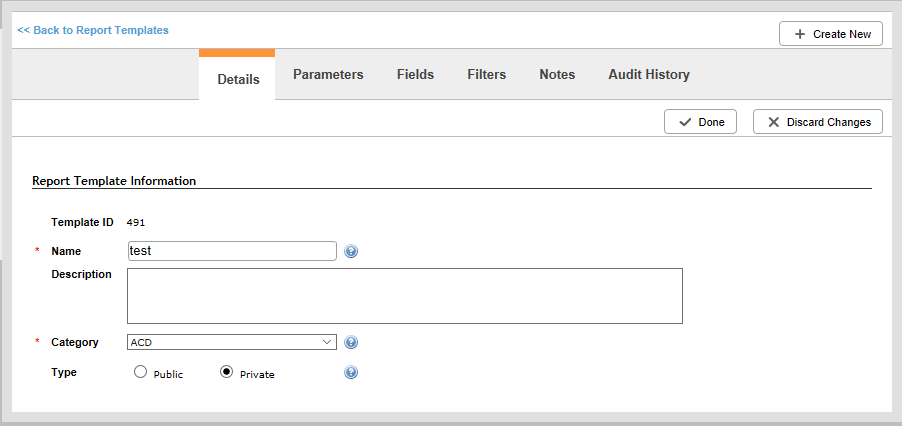
Use the search feature at the top of the table, the page navigation at the bottom, or the sort feature to locate the template you want to modify. Click anywhere in the row of the template to open it. When the Details page opens, click Edit.
-
Select a Name, Description, Category, and Type for the template if needed. Note that Global Type templates may only be copied and not edited.
-
Click Next.
-
Click Parameters, then Edit. Select a Date Range, Start/End Time, Time Zone, Time Format, Percent Format, and provide any desired Output Format specifications. If you want to add a header to the top of the generated report, select the header you want in the Report Template Header Name drop-down. Click Next.
The
It also stores only two rolling days' worth of hourly intraday contact detail data.
-
Click Fields, then Edit. Specify a Paradigm, Model, and Perspective. When you select a Perspective, all Fields and Metrics that do not relate to it disappear.
-
Select the Fields and Metrics you want the report to display. To do so, click the plus sign beside Attributes, Contact Detail Attributes, or Agent Detail Attributes for Fields or beside Amount, Time, Percent, or Count for Metrics. Select the checkbox of each feature or metric you want the report to display.
-
You can specify the order in which the features and metrics will appear in the report by using the Selected Metrics box. To move a metric up or down, click it and press one of the following buttons:
-
Up 1 – Moves the metric one space higher on the list
-
Down 1 – Moves the metric one space lower on the list
-
Up All – Moves the metric to the top of the list
-
Down All – Moves the metric to the bottom of the list
To remove features or metrics from the report, clear the corresponding checkbox. You can also remove metrics by double-clicking them in the Selected Metrics list.
-
-
Click Next.
-
(OPTIONAL) Add filters to the report template. Click Filters, then Edit.
-
Click Add Dimension Group to create a filter statement with attributes, like names or booleans. Click Add Measure Group to create a filter statement with metrics, such as numbers of occurrences or time.
-
Choose the selection you want to filter by, which can be any attribute or metric regardless of whether you include it in the report or not. Select an operator with which to compare the selection with the value. For more information about the operators you can choose, see Create Report Template: Filters Page. Choose or type a value.
-
To add another condition, click Add Filter.
-
Set the new drop-down on the left to and or or to set the relationship between this filter and the preceding one. Configure the rest of the filter as you did the previous one.
-
To add more filters, repeat steps A - D.
-
To remove filter statements from a group, select the minus button to the right of the statement. To remove a filter group, click the red X in the top right corner of the group window. Click Remove All to remove all groups and filters immediately.
- If you are editing a template, click Done.
-
- Click Done.
Reports run this way may contain up to 13 months of data and time out after running for three minutes. Running a report with more data or that takes longer requires that you schedule it.


