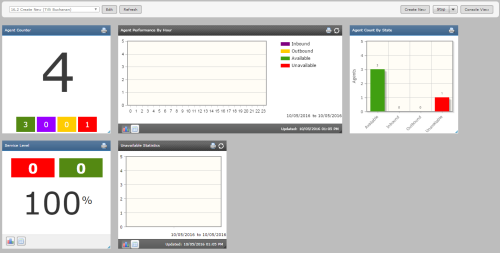
Dashboards allow you to view both real-time and historical information so that you can quickly see what is happening in your contact center and act accordingly. Each dashboard contains one or more Widgets Overview: self-contained modules with specific functionality. You can determine the specific information in your dashboard by selecting which widgets you choose to display. The following image shows a sample dashboard.
Each window in the dashboard is called a widget. When you log out, the dashboard that you have open is the same dashboard that appears the next time you log in. Dashboard data in real-time widgets refreshes automatically every five seconds with the exception of the Service Level and Skill Summary widgets, for which the refresh rate is five minutes. To refresh widget data immediately, click Refresh on the dashboard menu. To display a different dashboard, click the dashboard view drop-down and select another dashboard. Only your dashboards and those dashboards shared by other members of your business unitFile format associated with Microsoft Excel; may also be expressed as .xlsx will be available in the drop-down list.
Related Themes
Related Tasks
- Create a Dashboard
- Edit a Dashboard
- Delete a Dashboard
- Run a Dashboard in a Slideshow
- View a Dashboard in Console View
Related References
- Agent Count by State Widget
- Agent Counter Widget
- Agent List Widget
- Agent Performance Widget
- Agent Performance by Hour Widget
- Agent Zoom Widget
- Contact List Widget
- Contact States by Skill Widget
- Contact Zoom Widget
- Other State Statistics Widget
- Outbound Agent Performance Widget
- Queue Counter Widget
- Queue Trend Widget
- Service Level Widget
- Skill Summary Widget
- Unavailable Statistics Widget


