As a contact center supervisor or administrator, you are generally responsible for keeping track of contact center agent performance. To track performance, there are tools available for the dashboard to ensure that the contact center is functioning properly. Widgets are self-contained modules with specific functionality that can be installed and executed from a dashboard. Widgets provide a quick view of both real-time and historical data, whereas the reports are used for viewing historical data from a selected period (day, month, and so forth).
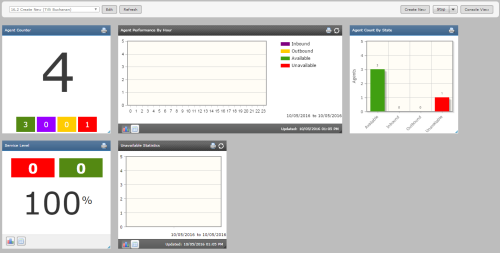
Each module in the preceding image is a separate widget, and each widget provides distinct data to the user. For example, the widget on the far left is called Agent Count by StateThe availability status of an agent.. This widget shows an administrator or supervisor the number of agents logged in and their current state (available, unavailable, and so forth). As shown, multiple widgets can be added to a dashboard.
Real-time widgets use the dashboard to display data as it is collected. The following image shows a sample real-time widget.
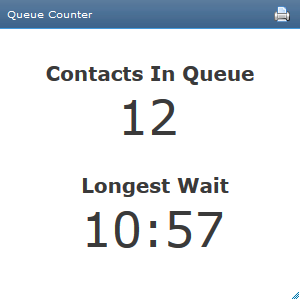
This widget is called Queue Counter. In this case, twelve customers are in queue, and the first caller has been waiting for 10:57 minutes.
By contrast, historical widgets display valuable historical data based on a set date range. Data in historical widgets is not automatically updated, which means you must click the browser's Refresh button to manually update the data. .
Real-time widgets display on the Real-Time tab, and the historical widgets display on the Historical tab.
Related Tasks
Related References
- Agent Count by State Widget
- Agent Counter Widget
- Agent List Widget
- Agent Performance Widget
- Agent Performance by Hour Widget
- Agent Zoom Widget
- Contact List Widget
- Contact States by Skill Widget
- Contact Zoom Widget
- Other State Statistics Widget
- Outbound Agent Performance Widget
- Queue Counter Widget
- Queue Trend Widget
- Service Level Widget
- Skill Summary Widget
- Unavailable Statistics Widget


